Homework Assignments (HW)
These individual assignments will help you develop your knowledge for design principles for Information Visualization. For each of these, the deadline to submit your work is by the start of class on the day they are due. Unless otherwise described, the submissions must be submitted via Canvas.
The grading distribution is broken down as follows.
Recall, HW assignments are worth 25% of your overall grade, broken down as:
- HW1: 1%
- HW2: 4%
- HW3: 7%
- HW4: 9%
- HW5: 4%
Programming Assignments are worth 30% of your overall grade, broken down as:
- P1: 2%
- P2: 3%
- P3: 6%
- P4: 7%
- P5: 12%
Homework 1: Survey
Complete this programming background survey. Nothing to submit on Canvas. Only submit 1 response per person.
Homework 2: Data Exploration and Analysis
The purpose of this assignment is to provide you with some experience exploring and analyzing data without using an information visualization system. Below is a data set (that can be imported into Excel, or any other data viewer you want to use) about cereals. You should explore and analyze this data using Excel or simply by hand (drawing pictures is fine), but do not use any visualization tools. Also, your should avoid the visualization and charting functionality of Excel for the purpose of this assignment. Your goal here is to perform an exploratory analysis of the data set, to better understand the data set and its characteristics, and to develop insights about the cereal data.
Submission: What you turn in should consist of four things.
- List (bullet list of items) five analytics queries or questions that a person may have about this data set. These would be questions that an analyst examining the data might be pondering.
- List (bullet list of items) five “insights”, chunks of knowledge, or deeper questions that you either encountered or gained while exploring the data. An insight could be some understanding of the data and its characteristics that is not relatively obvious or intuitive. It is something that most people might not realize initially. Note that an insight or knowledge chunk simply may be a deeper question that arose in your mind while exploring the data. And your analysis may not have been sufficient to answer the question.
- Write one paragraph about the process you used to do the exploration and analysis. Did you load the data into Excel, work manually, or do both? What did you do in Excel? Did you draw pictures? Did you take notes? What did you take notes on? What did you draw? This paragraph should be a general description of you analytic workflow.
- Write one paragraph about challenges or problems that you encountered in doing the analysis this way. Did anything limit or frustrate you? If nothing did, perhaps there was something that was more difficult than you thought it should be. Nothing is perfect, so you should be able to list some potential issues here. So, to sum up, your assignment should have two bullet lists of five items followed by two paragraphs.
Grading: We will evaluate the quality of the insights you listed and the detail given for the process you went through. We are looking for things that we find interesting or perhaps unexpected. This is subjective. For the second and third parts, we will evaluate if you did what the assignment asked.
Cereals data (xls format)
The data set should be pretty self-explanatory. The Manufacturer is a one letter code with the expected mapping (Q-Quaker Oats, P-Post, G-General Mills, K-Kelloggs, R-Ralston Purina, N-Nabisco) and Type is C (cold) or H (hot).
Homework 3: Visual Design
The purpose of this assignment is to provide you with practice and experience designing the appearance of data tables and basic visual charts. Below are two Excel spreadsheets. For the first (Part 1), you should create a table that presents its information as clearly and informatively as possible. Keep in mind the basic chart principles we covered in class.
For the second (Part 2), design a visual chart that does the same. Think about the data in each spreadsheet and what an analyst looking at that data would care about. You are allowed to derive new variables (attributes) that are combinations of the given ones, but you cannot make up totally new variables and values.
To create and render your designs, you can use colored pencils/markers if you’d like. You can also design, lay out, and draw your ideas in a computer tool such as Illustrator, PowerPoint, Photoshop, but you cannot use those tools to do any of the design for you. That is, tools that are not allowed include: Tableau, ggplot, Spotfire, Numbers, Excel, etc. Again, you don’t need a tool for this, hand-drawn is fine. If you want to use a tool, they should just be used as drawing tools — The ideas behind the design should be yours.
Submission: Scan or take a picture of your table and graph designs and submit to Canvas.
Grading: We will evaluate the effectiveness and design aspects of your creations, how well and how clearly they can answer a variety of questions about the data. Of course this is subjective, but we will look for tables and graphs that apply the design recommendations discussed in class and in our readings.
Part 1 dataset: Performance of sales representatives (xls format)
Part 2 dataset: Performance of different company departments over year (xls format)
Homework 4: Use and Critique Tableau
Use and critique Tableau – an Information Visualization System that does not require programming. This assignment will familiarize you with a full-featured InfoVis system – Tableau – which will be introduced in class.
The goals of the assignment are for you to learn the capabilities provided by Tableau (it is one of the best commercial systems), learn the basic visualization methods that it provides and assess its utility in analyzing data.
Groups of 2 are allowed for this assignment! You can write the report on this homework by yourself, or you can do it with a partner (which I encourage, it will be more fun and you will learn more). Note only groups of 2 are allowed, no larger. If you write with a partner, you will both receive the same grade. You may ask others for help with downloading and figuring out how to use Tableau. The paper and its ideas should be developed by you or by your two-person team.
The assignment has four parts:
1. Gain familiarity with Tableau – Familiarize yourself with the visualization techniques and the user interfaces during the class presentation, and via on-line videos at http://www.tableausoftware.com/learn/training
2. Examine the data sets – Browse several data sets to decide which one to use for the rest of this assignment. Decide on one, and then use the system to explore it further.
3. Develop three interesting questions about the selected data set – put yourself in the shoes of a data analyst, and think about all the different kinds of analysis tasks that a person might want to perform. For instance, someone working with breakfast cereal data might have analysis tasks like:
• Find all the information on Cocoa Pebbles.
• Identify the cereal with the least fat that is also high in fibre.
• What is the distribution of carbohydrates in the cereals?
• Does high fat mean high calories?
• Which of the following three cereals is best for people on a diet?
Do NOT make all of your questions be about correlations or min or max values.
4. Write a report – Part 1 – List your three questions and answers, along with a screen shot showing the visualization you used to answer each question. One page per question – screen shot and narrative. Each question should be answered with a different visualization – so three different visualizations (and not just different data overlaid on a map as can be done in Gapminder). Part 2 – Critique the system. What are the system’s strengths and weaknesses? For what kinds of user tasks is the system particularly well suited? Focus more here on the visualization techniques as opposed to the particular user interface quirks, though you should feel free to comment on UI aspects when they are particularly good or bad. Describe characteristics of the UI using the concepts and terminology you have learned in class. This second part should be close to 2 pages.
Submission: Your document should be in PDF format and is limited to a maximum of 5 pages, no cover sheet. Use Times Roman 12 point type with normal margins, 1.5 line spacing. Submit the paper via Canvas. If you worked with a partner, both of you are required to submit to Canvas, and ensure both of your names are on it.
Homework 5: Draw a Graph
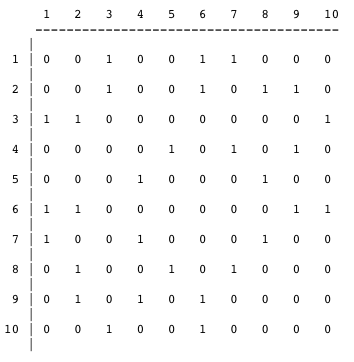
The purpose of this assignment is to give you an appreciation of just how challenging it is to lay out a graph (network) in the plane. Below is an adjacency matrix for an undirected graph. The nodes are labeled along both sides (1-10). Inside the matrix, a 1 indicates an edge, 0 means there is no edge.
Your objective here is to come up with a positioning for all the vertices such that an aesthetically pleasing graph drawing results. Please draw the graph using a standard technique: vertices are represented by some kind of glyph such as a circle, square, etc. with the vertex number inside. Edges are simply lines draw between vertices. Follow those basics, then you are free to embellish beyond that.
Submission: Take a picture (or scan) the piece of paper you drew your graph on and submit it to Canvas. In addition, submit 1 or 2 paragraphs that describing your design process and the method or algorithm you used to create the graph. Put your name on the page with your description of your method, not on the drawing page.
This is just a short HW, so don’t spend too much time or thought on it. (It turns out that you could spend the rest of your life on it.) If you follow the instructions, you’ll receive full credit.
Programming Assignments (P)
These individual assignments will teach you the basic skills for developing web-based visualizations. You are expected to complete these assignments using d3.js.
It is good practice to develop your assignments using some sort of version control. GaTech gives you access to GitHub, which is a good one to use if you haven’t done so already.
D3.js is the Javascript InfoVis toolkit we will use for the programming assignments. Go through the following short tutorial on the fundamentals and set up of D3.
(1) http://alignedleft.com/tutorials/d3/fundamentals
(2) http://alignedleft.com/tutorials/d3/setup
Warning: There are many existing examples and source code widely available online. While these are great resources for you to learn, note that copying these is considered a breach of the rules from the Office of Student Integrity, and will be handled accordingly. Be careful and thoughtful. Many of the assignments will ask you to start from existing source code or examples. In these cases, it is expected that parts of your assignments will resemble the original. You are expected to start with these templates and build your submission to the assignments from there.
P1: Create Simple Charts using SVG
(adapted from Carlos Sheidegger’s InfoVis course assignment: https://cscheid.net/courses/spr18/csc444/)
In this assignment you should draw simple SVG elements on a webpage, and build simple visualizations from them. These visualizations should be created using HTML, CSS, and SVG (no d3 yet, that comes later).
The webpage you create will have four charts: a single bar, one bar chart, one line chart, and one pie chart. Each chart should be drawn in an svg element of size 400×400 pixels. The layout is not important for this assignment. You can stack these vertically on top of each other. The name of the file should be visualizations.html.
1. Draw a Single Bar
Create a single bar with the height of 250. The color of the bar should be red. The bar will look like this:

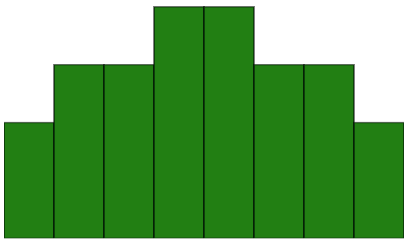
2. Draw a Bar Chart
Next, you’ll draw a bar chart. Your bar chart should take all 400 pixels in the SVG. The individual bars should have the following height, in order: 150, 225, 225, 300, 300, 225, 225, 150. The bar charts will look like this:
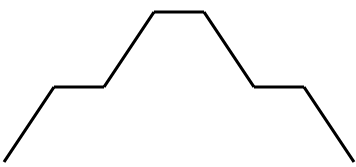
3. Draw a Line Chart
Your line chart should be composed of the SVG line element. The heights of the vertices in the polyline should be the same as the heights of the individual bars for your bar charts. The resulting line chart should look like the following figure:
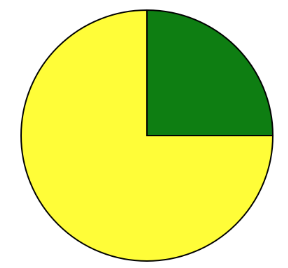
4. Draw a Pie Chart
Your pie chart will have two wedges. The first wedge will span 90 degrees and will be green, and the second wedge will span the remaining 270 degrees, and will be yellow. Your pie chart will look very similar to this:
What to turn in
Submit your visualizations.html file to Canvas.
Grading
Your assignment will be graded along the following requirements:
- Created all 4 visual charts.
- Design of the charts adheres to the instructions above.
- Did not use other visualization libraries other than what is specified.
- When hosted, your html page renders the visualizations as specified.
You will not be graded on any of the following:
- The styling of the charts, axes or labels (within reason)
- Conventions or legible html code
P2: Create a Static Visualization
In this assignment you will create two bar charts on the same web page. The bar charts show the total coffee sales for a chain of coffee shops. Your submission should create a web page containing a visualization that looks like this:
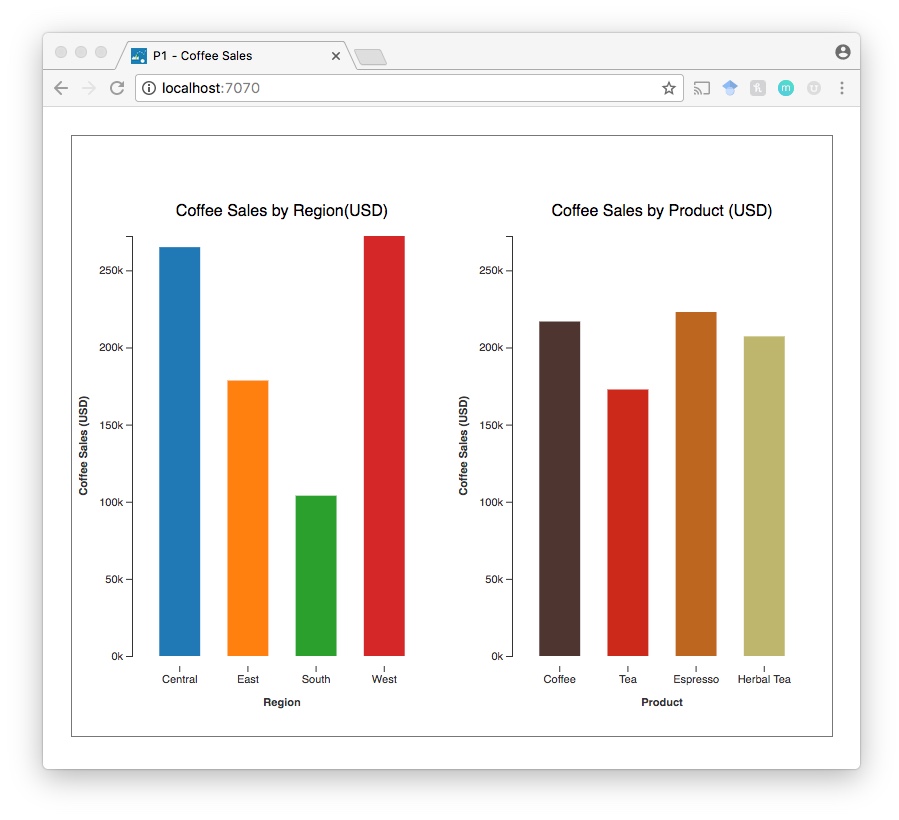
The first bar chart shows the total sales per region (i.e. Central, West, East, South). The second bar chart shows the total sales per product category (i.e. Coffee, Tea, Espresso, Herbal Tea).
You will use the dataset coffee.csv (on Canvas) to create both of these charts.
Notice, that this dataset is not in the form that you will need. You will need to aggregate the data for the region and category data attributes and then compute the total sales. For this assignment, you are required to accomplish this with JavaScript code (the d3-nest functionis a great place to start). Do not use Excel, Python, etc. to create the aggregated dataset.
Reminder that this is an individual assignment. The code you turn in should be your own creation. You are certainly welcome to seek assistance from the TAs as you work on the assignment, however.
Starter code
The started code for this assignment can be found on Canvas. You are required to use the starter code for this programming assignment.
What to turn in
You will submit your code via Canvas. Compress your code into a zip file. Upload and submit this zip file to Canvas by the deadline.
Grading
Your assignment will be graded along the following requirements:
- Creates 2 bar charts that show the required data from the instructions (1 chart for regional sales, 1 chart for sales by product category) – we will check to make sure the bar charts are data accurate.
- Your code processes the raw data (all of the sales data rows) to create a data structure for the 2 charts – d3.nest() is a good place to look – you will lose points if your JavaScript code does not process the data and you instead used another tool such as Excel to create an aggregated dataset file.
- You are required to add labels and axes for both charts.
You will not be graded on any of the following:
- The styling of the charts, axes or labels
- The colors you decide to use
- The spacing or width of the bars
- Conventions or legible D3 code
P3: Filtering and Animations
For this assignment you will create a simple form of interactive visualization. Specifically, you will create a filtering mechanism. The starting code and data file on Canvas (called P3.zip). Note that the design of the filtering mechanism is not part of this assignment. This should just focus on the filtering and animation functionality.
This assignment requires you to:
- Read data from the provided CSV file (provided in the .zip).
- Using D3, draw a bar chart for the provided data.
- Add a drop-down filtering mechanism on the page to allow the user to select a color for the filter.
We recommend using drop-down menus (aka HTML Select).
Give a choice of at least 3 colors. - Add a text-box to enter a numerical value for the cutoff.
- Add a Filter button on the page (explained below).
- Animate the filtering behavior, utilizing both duration and delay methods provided by D3 (as in the sample code). The bars that should be filtered out should be hidden (not visible).
- Add a “Reset Filter” button which clears all filters and allows the user to start over.
The resulting visualization should look something like this:
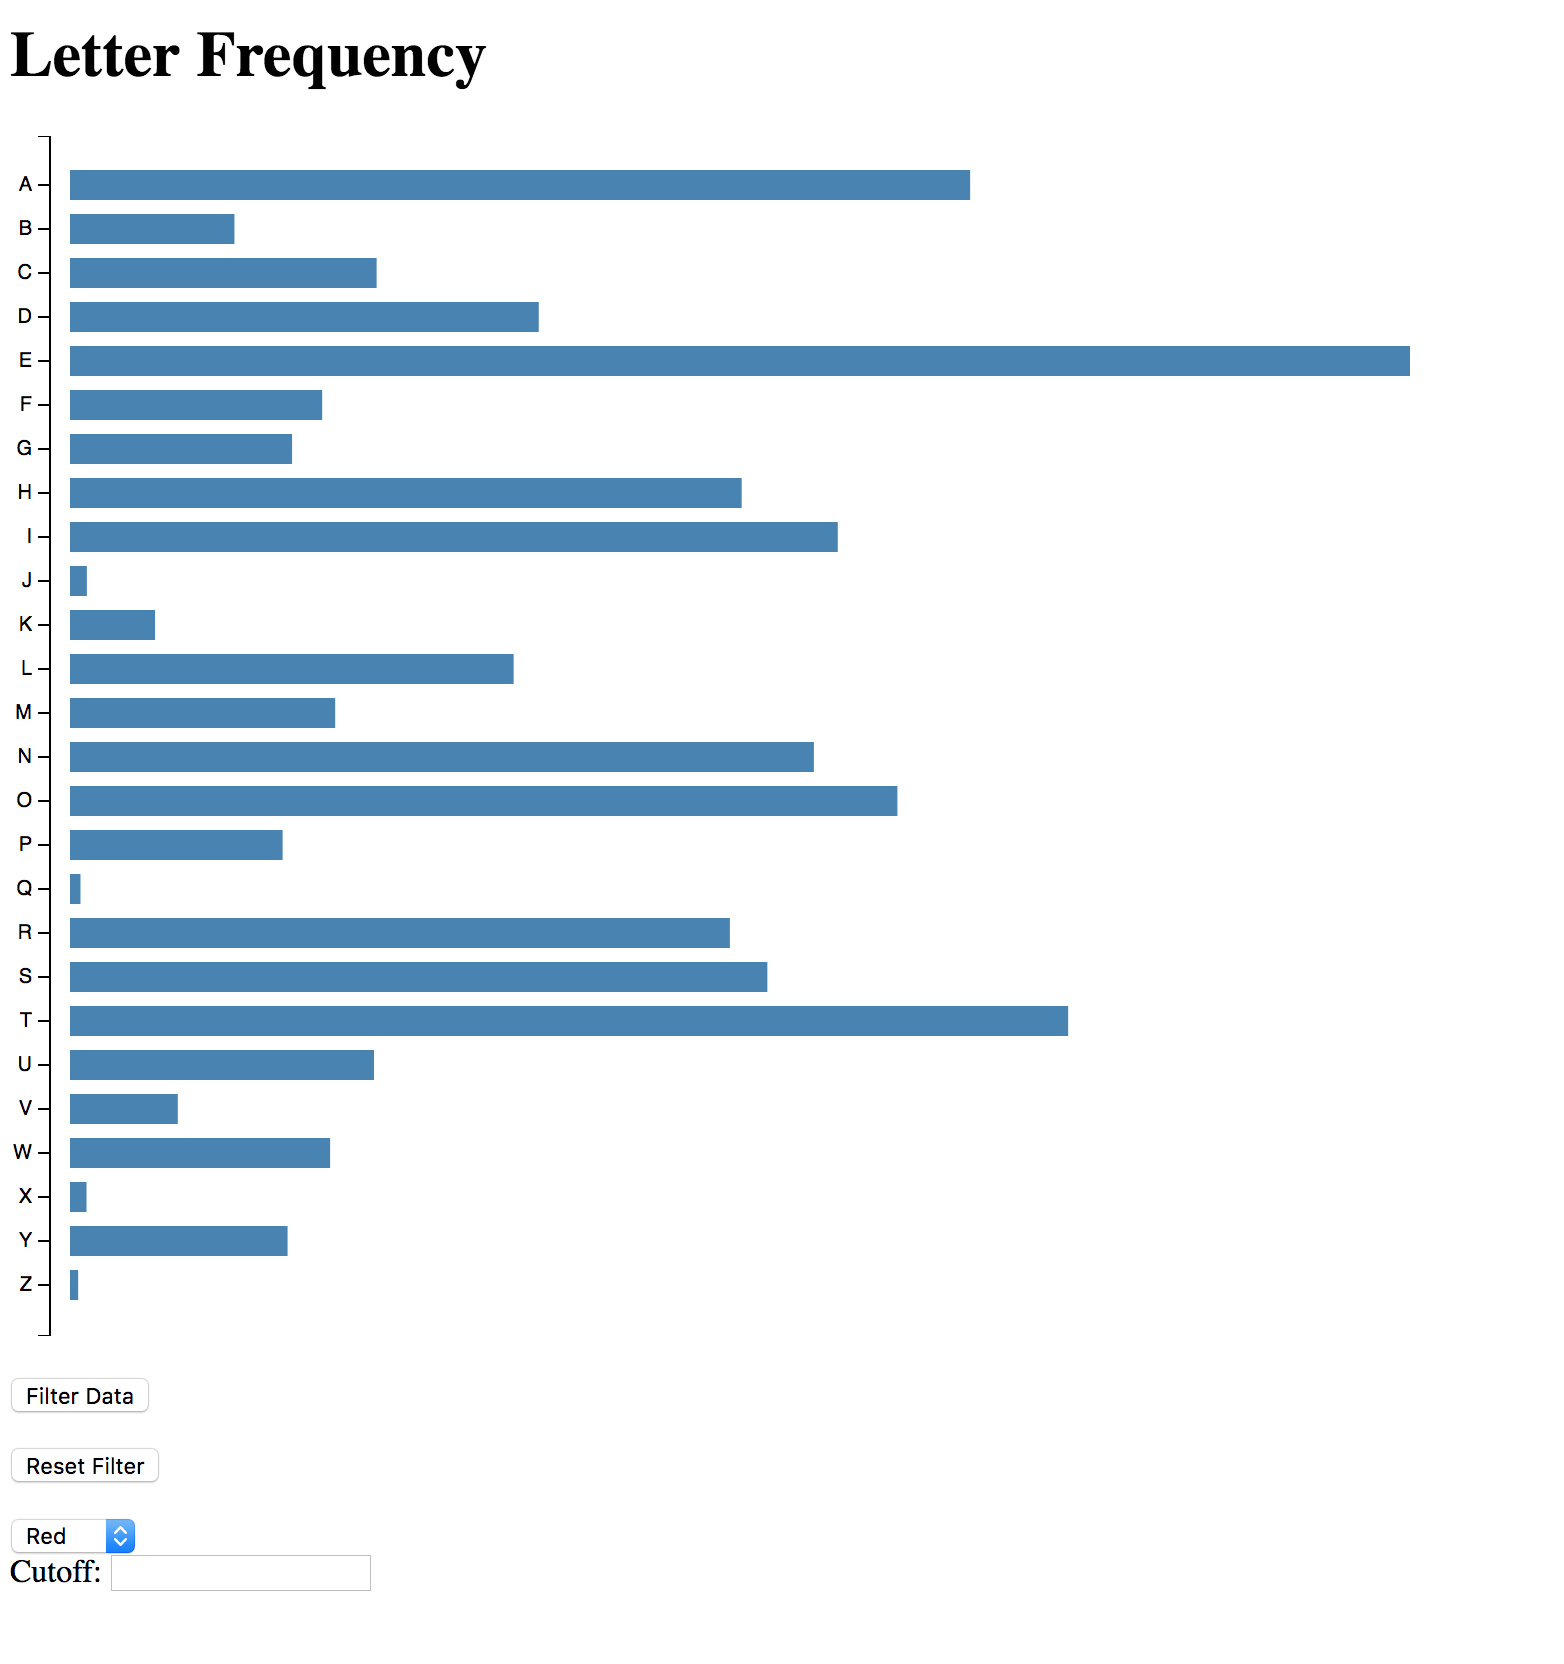
Expected filtering behavior and Grading: When the user clicks on the Filter button, your code should filter as follows:
- The selected color from the dropdown is used to color the bars that fall within the filter. There should be at least 3 choices.
- Letters whose frequency are greater than or equal to the value entered in the text box turn the selected color.
- All other bars are hidden.
- Clicking “Reset Filter” should reset the filters and let the user start over (all bars should be blue again, and shown)
Example: If the user selects “Red” in the drop down menu and types “0.01” in the text field, your visualization should show all the bars that are greater than or equal to 0.01 in Red, and hide all the other bars. If the user clicks “Reset Filter”, all bars return to blue and are shown again, and the user can start over with another filter.
Submission guidelines: Upload a .zip with all your code to Canvas by the submission deadline.
P4: Brushing and Linking
This assignment requires your to build a visualization that utilizes multiple coordinated views using brushing and linking. You are given (in the starting code) two scatterplots that show different attributes of your data. Your task in this assignment is to add the interactivity that allows selections in one view to highlight corresponding data points in the other view (i.e., brushing and linking).
The dataset you will use for this assignment consists of SAT scores. For the first scatterplot, SAT mathematics scores (SATM) should be mapped to the x coordinate and the SAT verbal scores should be assigned to y coordinate. For the second scatterplot, the ACT attribute should be mapped to the x coordinate and the GPA attribute should be mapped to the y coordinate. Each scatterplot should be drawn in an svg element of size 400x400px.
The resulting visualization should look like this:
Starter code
The starter code for this assignment is available on Canvas. You are required to use the starter code for this programming assignment.
What to turn in
Compress your code directory into a .zip and submit to Canvas before the deadline.
Grading
Your assignment will be graded along the following requirements:
- One scatterplot with SATM and SATV axes
- The second scatterplot with ACT and GPA axes
- When users click on a point in either scatterplot, the actual numerical values of the fields for that particular student are displayed in a separate table (details on demand).
- When users drag the mouse on either scatterplot, a rectangular brush is drawn on that scatterplot, indicating the region of interest. All the points inside that region are considered selected and should be highlighted on the other scatterplot.
- The rectangular selection should be draggable by clicking and dragging the left mouse button.
- When users click on a point in either scatterplot, the corresponding point on the other scatterplot is highlighted
- When switching brushing between visualizations, the previous brush should be cleared. For example, brushing in view 1, then brushing in view 2, the brush in view 1 should be cleared (removed).
You will not lose points on any of the following:
- The styling of the charts, axes or labels
- The colors you decide to use
- Conventions or legibility of your code
P5: Putting it all together
This final programming assignment of the term is a more open-ended data visualization challenge. We have identified five potential datasets for you to visualize (P5-datasets.zip on Canvas). You should select one, then design and implement an interactive visualization of the data. This assignment will be done in pairs of students. Ideally, you and your teammate will take the knowledge and background that you are learning this semester about Information Visualization and put it to good use in a new, creative effort.
Because you do not have an extended period of time to work on the project, we recommend that you quickly select one of the datasets. Next, you should come up with a design for your visualization. To do this, think about the kinds of questions someone might have about the data and the kinds of insights they’d want to take away from your visualization. For visualizations that are more about analysis and exploration, remember the analytic tasks that we have been discussing all semester. Make sure your visualization supports many of them. If you are doing more of a storytelling visualization, then think about the aspects of the data and “messages” that you want to communicate. Don’t spend too long working on your design, however, because it’s important that you leave enough time for the implementation. Feel free to meet with the professor and/or TAs to run design ideas by them for early feedback and thoughts.
You must implement your visualization for the web, using D3 and Javascript. Feel free to use other libraries that may be helpful to you. Where applicable, leverage the visualization design paradigms and techiques that we have learned about this term (e.g., overview and detail, dynamic queries, brushing and linking, various visualization techniques, etc.) In terms of complexity, fidelity, and depth, we’re looking for something on this assignment along the lines of the visualizations from P4. We are looking for interactivity, potentially multiple views, and an overall design that adheres to principles that we’ve covered in this course.
The five available datasets are stored in the Datasets folder on Canvas. Each has approximately 1000 data cases and a fairly large number of attributes as well. Important: You do not need to use every attribute included in the data set. It is up to you to select which attributes you want to include to make an effective visualization. We would prefer, however, that you do utilize all the data cases in your visualization.
What to turn in
You should create a zip file and turn it in via Canvas. We will not accept any late turn-ins for this assignment because that is going into reading week. In the folder that you zip up, you should also include a file named description.pdf that is a short project overview document. The document should be about 3 pages and include the following items: team member names, dataset chosen, list of analytic tasks it supports, design overview (1-2 paragraphs, including analytical questions and/or communicative objectives about the data), screen shot(s) of the user interface, and a description of any aspect of the interface/visualization that you feel needs explanation. It’s OK for your document to be longer if you include a lot of figures.
Grading
The following questions will be important for our evaluation of this assignment.
- Does the system work? I.e., does it read in the data and present an interactive visualization of the data? Is it usable and comprehensible? Does it not crash?
- Is the visualization an effective representation of the data? Is it clear and useful, and does it effectively communicate different aspects of the data?
- Does the visualization support different analytical questions and/or communicative objectives about the data? These objectives should be made clear in the description.pdf file you submit.
- Does the visualization effectively apply the ideas we learned all semester? Does it follow good visualization design principles?
- Does the visualization exhibit some creativity? While we are not expecting totally innovative new representations, we are looking for visualizations that are not simply copies or “rip-offs” of existing visualizations.
The grade earned for the project will be a team grade, that is, both team members will earn the same score for the project. However, the professor reserves the right to adjust individual team member’s scores either upward or downward to support especially strong or weak performance and contributions to the group effort, as much as he can objectively determine. It is acknowledged that not all team members will bring the same skills to the group. It is each member’s responsibility, however, to make a significant contribution in whatever way that best matches his or her abilities.
Tips for a Successful Vis
We highly recommend that your vis be implemented in one of three potential styles, as described below.
The first style of successful vis might be the “Scrollytelling” type of webpage that has a long vertical narrative with a number of interactive visualizations embedded onto the page. Here, you should feel free to follow a more narrative, storytelling style of project where your visualizations are accompanied by text and images to help communicate interesting aspects of the data set. A few examples of this style of visualization include:
- Americans are Completely Addicted to Trucks
- Street Names
- California’s Getting Fracked
- MBTA Data
- China’s economic slowdown
The second style involves a visualization system that likely has only one view/representation (or perhaps a couple) but this representation is a new and innovative technique or visual metaphor. Here, you should focus on designing a creative new visual representation. The actual user interface may have different components or pieces, but it should be tightly integrated. The real focus here is on creativity and innovation. A few external examples of this type of project are:
The third and final type of successful vis employs multiple coordinated views where each view may use some well-known visualization techniques, perhaps customized a little for this problem. There is likely nice filtering and interactive selection and focus in in the interface. The emphasis in this type of project is to create a sound, functional system implementation that clearly can be of help for data analysis and understanding. It is important in this type of project to have coordinated views that work well together and provide different perspectives on the data. This type of project does not have the same level of visualization innovation as the second one above, but it comes together in a strong system implementation. It is really more of a software engineering effort. A few external examples of this type of project are:
One way to carry out a poor project is to have each group member go off on their own and implement a different view, where the views have relatively little to do with each other. Systems like this usually have an interface where the user picks one of the views, and then that view takes over the window or screen, having very little to do with the other views. We don’t consider this to be a very good example of an effective information visualization. Another poor project style is one where the tool has a lot of functionality (menus, controls, etc.), but none of them really help people perform the tasks the tool is intended to help with. In CS more broadly this is often called “feature creep”, and it can easily happen in vis also.